Last week, during the Swiss Oracle User Group Day in Bern, hosted at Mobiliar as part of its 200-year anniversary, Moritz Werning from Swisscom and Erika Sciunzi from Oracle presented the use case behind the implementation of the FinOps dashboard I recently talked about (more details here)
The Motivation
The customer began by explaining why such a dashboard is needed.
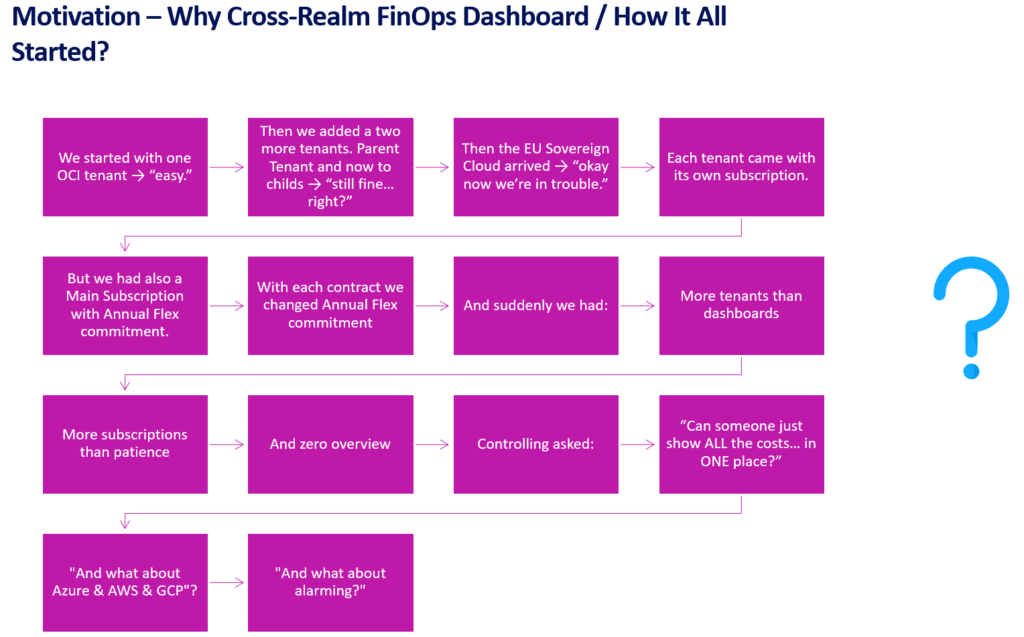
The slides clearly reflected a common challenge: controlling cloud costs in a hybrid cloud environment built across different tenants and subscriptions, different realms (Public and Sovereign, for example), and even multiple hyperscalers.
Customers often need strict separation of cloud environments for security and compliance reasons. However, from a cost-management perspective, budgeting, forecasting, and chargeback—an integrated view is essential. Jumping between different systems and manually aggregating cost data is not scalable and can easily lead to errors and blind spots.
This was exactly the situation the customer faced. They started with a single OCI tenant, then added new projects, which led to additional tenants. Their first step was to organize subscriptions under a common parent tenant where the credits reside, and to associate the service tenants through a parent–child relationship (Subscription Mapping Management Subscription Mapping Management). This temporarily solved the problem of providing an aggregated spending view across tenants.
New Challenge – EU Sovereign Tenant
However, when an EU Sovereign Cloud tenant was introduced, the limitations became apparent. While it is possible to charge the public parent tenant for spending in the sovereign tenant (via cross-realm credit sharing EU Sovereign Cloud FAQ | Oracle), the strict separation between OCI public tenants (OCI1) and sovereign cloud tenants (OC19) means that no data is shipped between those realms, including cost and usage data.
Open Source Solution
At that point, the open-source solution my colleague Erika Sciunzi implemented, deployed and published on GitHub came into play (details are available in the GitHub repository).
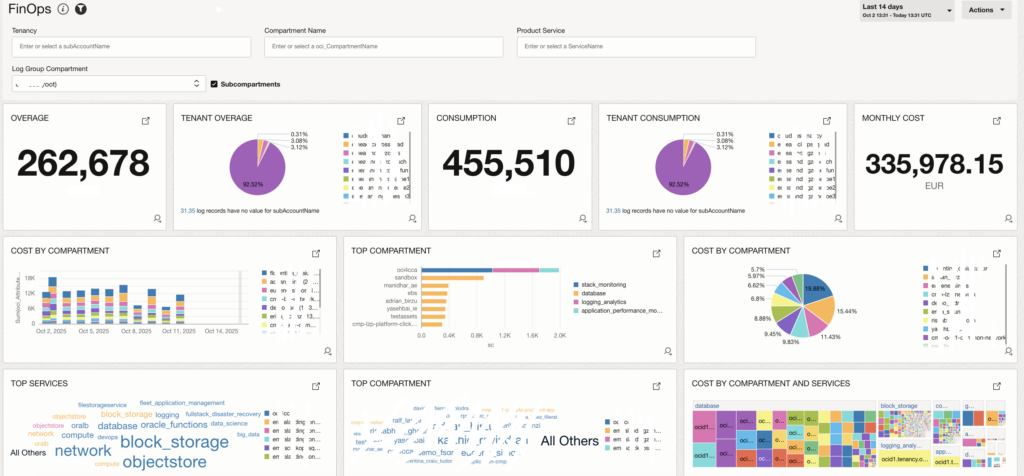
The approach is intentionally simple and is built on OCI Logging Analytics. It is designed for financially oriented users who may not have deep IT expertise. You can set up a first working version by following the GitHub instructions, then customize it using the dashboard’s intuitive GUI.
A key design choice is that the solution relies on FOCUS reports, which are a cross-provider cost reporting standard. This makes it possible to aggregate and compare cost data not only across OCI tenants and realms, but also across different hyperscalers.
Bridging the realm separation: how the data moved
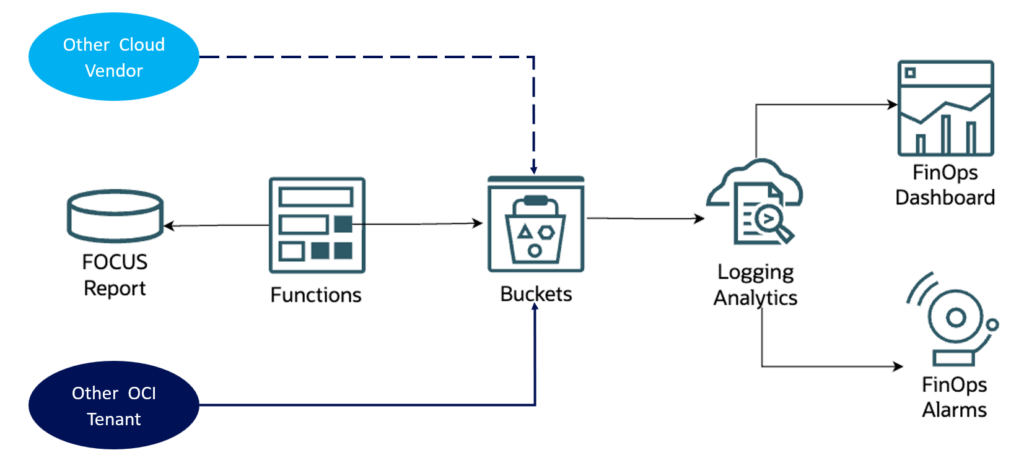
A natural question is: how do you move data from a Sovereign tenant into the Public tenant where the dashboard runs, given the realm separation?
Mika Rinne, another Oracle colleague, helped implement a straightforward mechanism: the FOCUS report from the sovereign tenant is transferred via a function into a private bucket in the public tenant. From there, the data is imported into Logging Analytics and visualized in the dashboard.
Added value: cost alerting
Beyond reporting, the solution also enables alerting on cost trends and anomalies. This makes it easier to identify which services are consuming more than usual, detect gaps where budgets aren’t configured properly, and proactively address issues, helping service owners and controllers avoid unwelcome surprises when the bill arrives.
Erika and Mika are continuing to evolve the dashboard, including integration of additional hyperscalers and enrichment with AI capabilities. So stay tuned: more features are on the way.
Solutions like this happen when customer needs meet passionate, customer-oriented people who enjoy solving real problems: and Erika and Mika are a great example of that.